A Hedge Fund Built an AI That Beats the Market on Merger Odds
Balyasny Asset Management just published a research paper describing an AI system that forecasts M&A outcomes -- and on a held-out set of 404 large deals, it beat calibrated market-implied probabilities, a tuned statistical model, and every frontier language model they tested it against. We're breaking down how the system actually works, with a focus on the part we found most useful: a 12-agent research pipeline that maps almost exactly onto how a good merger-arb analyst already thinks about a deal.
The task is deceptively simple to state: given an announced M&A deal, predict whether it closes on the announced terms, gets terminated with a better outcome for target shareholders (a higher bid shows up), or gets terminated with a worse one (no rescue bid materializes). That three-way split matters more than it sounds -- a "failed" deal isn't automatically a loss for the arb, and lumping the two failure modes together throws away real information.
Balyasny built a dataset of 1,648 public-target M&A deals from 2022 through 2025, restricted to genuine control transactions above $1B in deal value (so no minority stakes, asset sales, or SPACs), and used an ensemble of AI research agents to fill in gaps in deal terms, timelines, and competing-bid history. They held out the most recent 404 deals as a genuinely out-of-sample test set and measured performance using the Brier score, a standard way of scoring probabilistic forecasts where lower is better.
Their finetuned system beat every baseline they tested it against: 24% better than calibrated market-implied probability (the theoretical benchmark for "what the spread already tells you"), 19% better than a tuned XGBoost model built on 26 deal-specific features, and 25-42% better than frontier language models -- including Claude, Gemini, and GPT-5.1 -- given access to the identical research context. Worth sitting with that last comparison: simply pointing a strong general-purpose model at good context wasn't enough. What actually closed the gap was finetuning the model specifically on the outcomes of historical deals.
One detail we found genuinely reassuring rather than alarming: the system's forecasts correlate with market-implied probability at only 0.36, versus 0.75 for the XGBoost baseline. In plain terms, it isn't just a fancier way of re-deriving what the spread already says -- it's reaching different conclusions in a meaningful number of cases, and those different conclusions are, on average, more accurate ones.
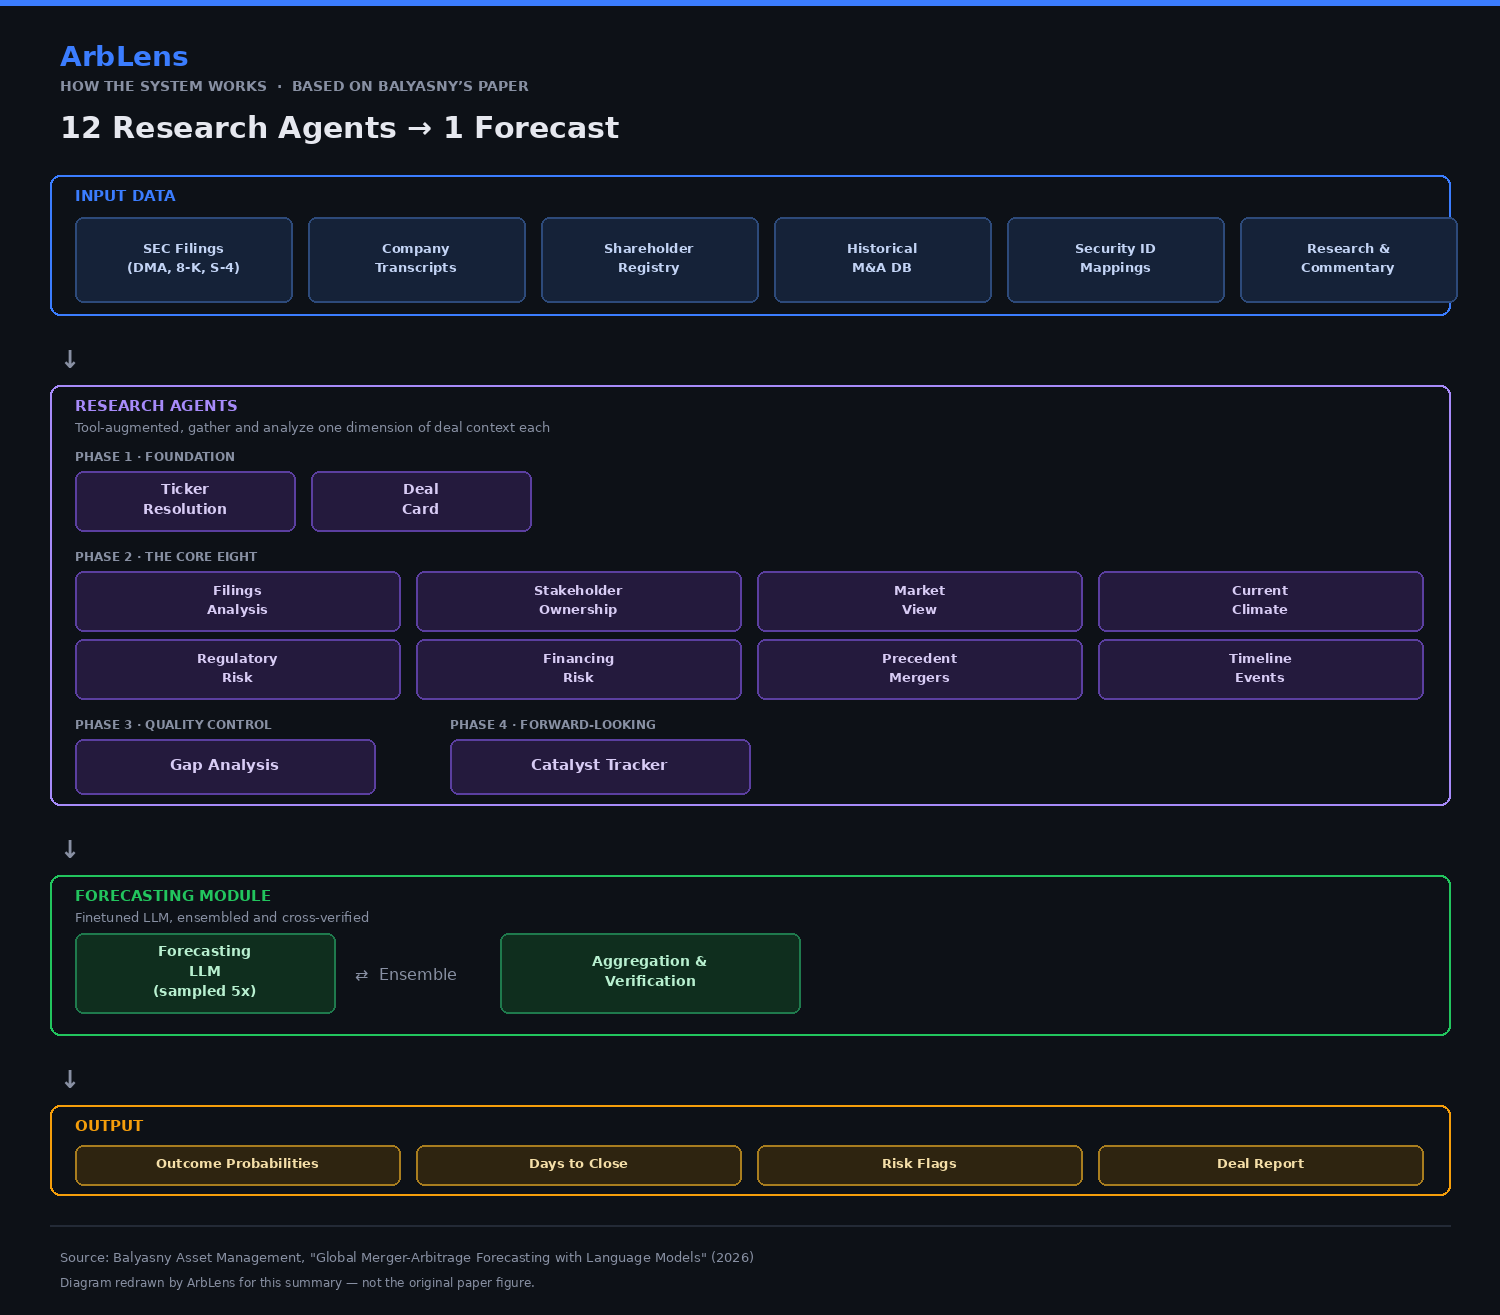
This is the part of the paper worth understanding in real detail, because it's essentially a blueprint for how to think rigorously about deal risk, whether or not you're using AI to do it. Before any probability gets generated, twelve specialized research agents each dig into one specific dimension of the deal, working in four phases:
The paper includes a small qualitative test that's more useful than most of the statistics: take one real deal sitting at an 82% baseline probability of a positive outcome, and see how the model's forecast moves when you hand it a single new piece of information. A proxy advisor (ISS) recommending shareholders vote against the deal dropped the probability nine points. A major shareholder publicly opposing the deal dropped it 28 points -- by far the largest single-factor swing they tested. A bidder raising its offer 10% pushed the probability up nine points. None of this will surprise anyone who trades merger arb for a living, which is exactly the point: the model's reactions to new information look like the reactions of someone who actually understands the mechanics of a deal, not a black box producing numbers that happen to correlate with outcomes.
The most useful section of the paper, in our view, isn't the leaderboard -- it's the failure analysis. Balyasny took the system's 100 worst forecasting errors and had another model classify the root cause. Sixty percent traced back to missing, stale, or simply incorrect context in what the research agents had retrieved -- not flawed reasoning once the model had the facts. Another 20% were cases where the right fact was present but under-weighted. Only 17% were genuine miscalibration, and zero were outright hallucination.
That distribution should sound familiar to anyone who does this work by hand. The hard part of merger arbitrage was never really the arithmetic of computing a spread -- it's the unglamorous grind of tracking down the right filing, catching the ownership change that just got disclosed, noticing that a company's own guidance quietly shifted a close date. Get the facts right and the reasoning mostly follows. Get the facts wrong or stale, and no amount of sophistication in interpreting them saves the forecast. It's the same discipline we try to bring to every deal note on this tracker, and it was genuinely useful to see a rigorously-built AI system arrive at the identical conclusion about where its own errors actually come from.
Full credit for the research, methodology, and data referenced above belongs to Balyasny Asset Management. Read the complete paper at arxiv.org/abs/2607.09921.
Nov 10 — $IMXI hard outside date. DFPI reinstatement has been silent for over a month.
Oct 5 — $BLFS shareholder vote.
Late Sept (est.) — $ZIM revised proposal to Israel's cabinet.
Sept 30 — $CCO close-adjacent date.
| Ticker | Deal | Spread | Key Risk |
|---|---|---|---|
| $BHF | Aquarian / Brighthouse | 40.3% | Aquarian missed original deadline; Delaware regulator questioning capital sources |
| $IMXI | Western Union / Intermex | 31.8% | DFPI silent 34+ days; stock down 11% this week on no news |
| $UNF | Cintas / UniFirst | 17.7% | FTC Second Request still open |
| $NSC | Union Pacific / Norfolk Southern | 17.0% | STB review runs into 2027 briefs |
| $ZIM | Hapag-Lloyd / ZIM | 16.4% | Revised proposal still needs cabinet approval |
| $WBD | Paramount Skydance / WBD | 11.6% | Possible settlement reported this weekend -- number likely stale |
| # | Ticker | Why | Gross Spread | Annualized |
|---|---|---|---|---|
| #1 | $CCO | Cleanest deal-specific risk profile tracked — vote and HSR done, CFIUS the only remaining gate. | 2.1% | ~77% |
| #2 | $PERF | 81.2% of voting power locked into support agreements, fully self-funded. | 3.6% | ~13% |
| #3 | $WBD | Regulatory fully resolved; possible settlement reported for this weekend. | 11.6% | ~24% |
| #4 | $IMXI | Highest raw annualized in the group (short modeled duration); DFPI caveat unresolved but not worsening. | 31.8% | ~228% |
| #5 | $BHF | Second-highest (short modeled duration); real story now behind the widening, not unexplained. | 40.3% | ~191% |
| #6 | $IRDM | Collar-adjusted; genuinely improving profile, vote support agreements cover ~1.6% of shares. | 11.5% | ~15% |
Annualized figures use ArbLens's modeled expected close, not a deal's outside date or next catalyst, and aren't probability-weighted.
Live spreads, spread history charts, What’s Changed logs, and full deal analysis on all 68 active deals.
View All 68 Deals on ArbLens →If you find ArbLens useful, consider sharing it with at least one person who might benefit — a fellow investor, analyst, or anyone who follows M&A. It’s free, and word of mouth is how this community grows. arblens.com
Real-time deal alerts, spread movements, and analysis as they happen — follow @ArbLens between issues.
@ArbLens — Follow for Real-Time UpdatesGet weekly merger arb insights delivered to your inbox — spreads, regulatory updates, and what to watch next.
For informational purposes only. Nothing here constitutes investment advice. Merger arbitrage involves significant risk including deal failure and loss of capital. The research summarized in this issue is the original work of Balyasny Asset Management; ArbLens's summary is our own condensation and analysis, not a substitute for the original paper. Data sourced from public filings and third-party sources. Spreads shown are as of September 20, 2026 and update nightly on arblens.com.